EURUSD is a great pair. It always gives you low risk and high reward trades if you know how to trade it naked. Have you ever tried trading naked? Naked trading is a technical term that professional traders use for a trading style that depends solely on pure price action without using any indicator. If you are new to naked trading, you should watch this 1 hour recorded webinar on how to trade price action trends naked. Now let’s get back to our topic: How to trade EURUSD naked? Take a look at the screenshot below!
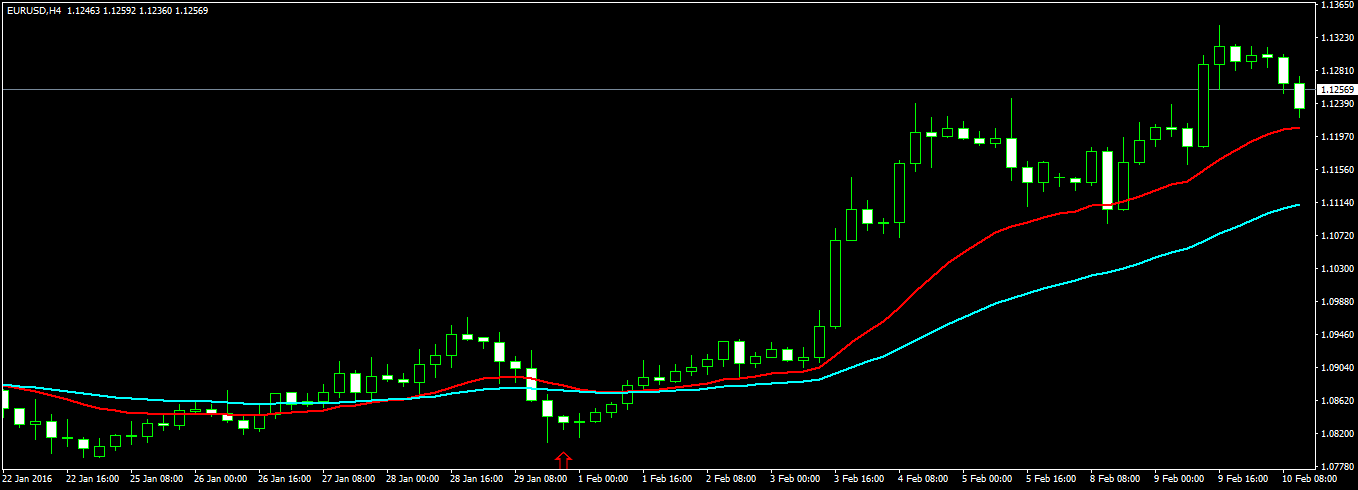
Do you see the very beautiful pure price action pattern in the above screenshot just above the red arrow? This beautiful pattern is known as the Inside Bar Pattern. It is also known as the Harami pattern. Whatever, it is a powerful signal that price found it difficult to break below the support formed by the mother candle. Now this pattern on daily and H4 timeframe is much more powerful as compared to the lower timeframes. When you trade with this pattern, always try to look at the over price pattern picture. You can see in the above screenshot that price went up then made a retracement and was unable to break below the support formed by price action previously. When price is unable to break a previous support/resistance, it forms a 1-2-3 pattern. This 1-2-3 pattern is powerful trend reversal signal. Let me make it clear with the screenshot below!
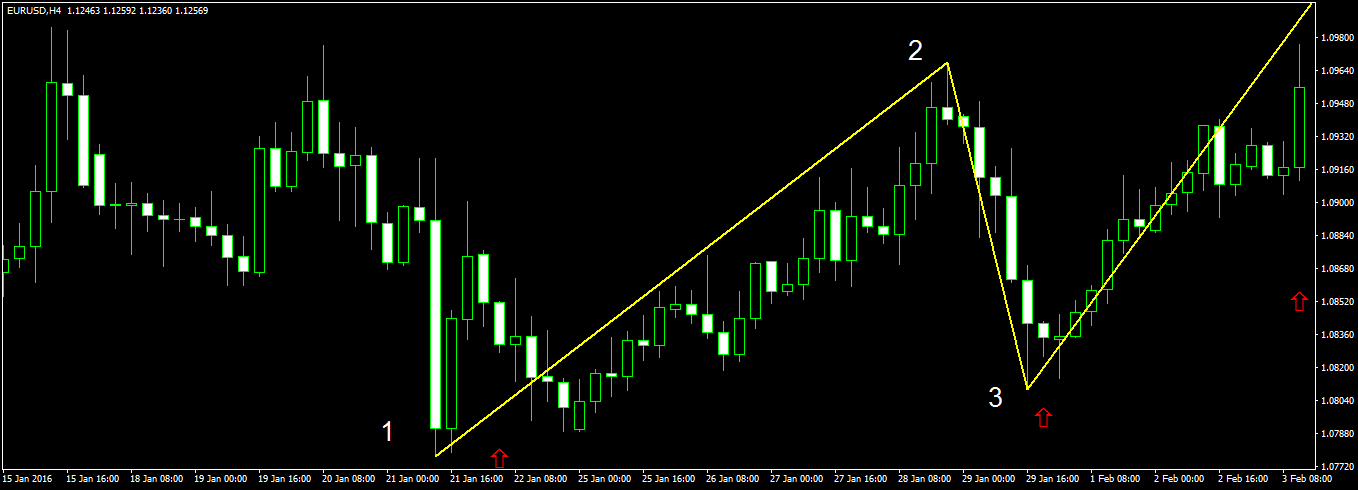
In the above screenshot, I have marked the 1-2-3 pattern. 1 shows the level when price action found support. Then it rallied and went up to the 2 level. At that point it made a strong retracement and tried to break below the support level formed at 1 but couldn’t. This is the level 3 marked in the above screenshot.
Important question: How do we know at 3 that price will be unable to break below the previous level of support formed a few days back? The inside bar pattern that is marked in the first screenshot is a signal that the 1-2-3 pattern has been formed and price is finding it difficult to break below the level 3 in the above screenshot. So we make an entry at 1.08351 and the stop loss is 1.08100 with one standard lot. So the risk is very small it is just 25 pips. We choose 400 pips as our profit target.
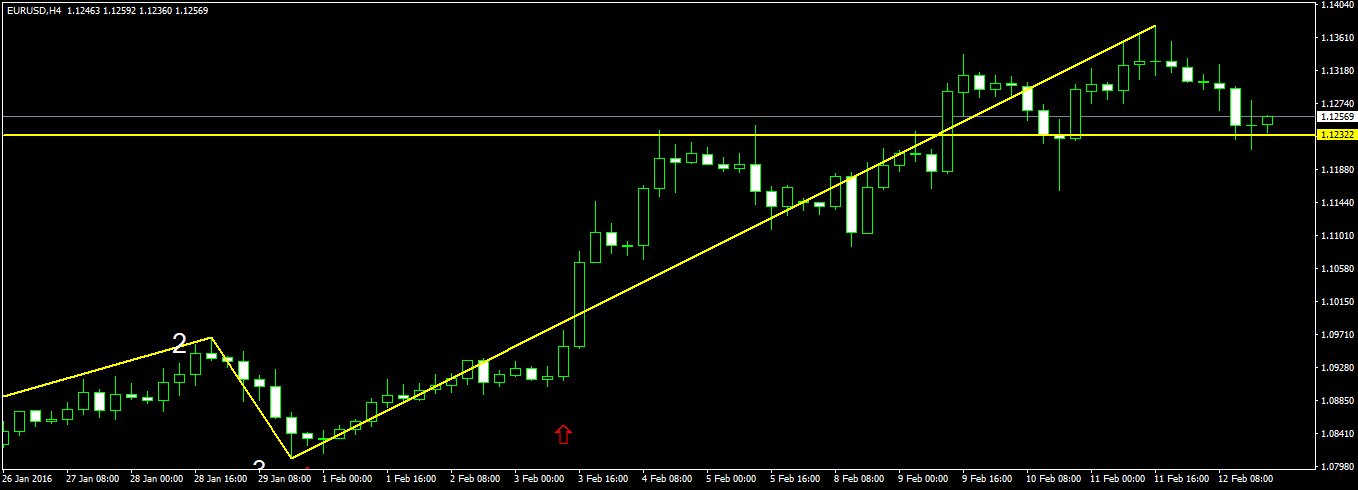
In the above screenshot, you can see a yellow line that starts from the level 3 and cuts the horizontal yellow line which is our profit target. So in the next few days, we move the stop loss below the level just shown above the red arrow in the above screenshot to 1.09000 and open a new position at 1.09169. The first position is now in a profit of 65 pips. The risk for the second position is only 16 pips. So we use 2 standard lots.
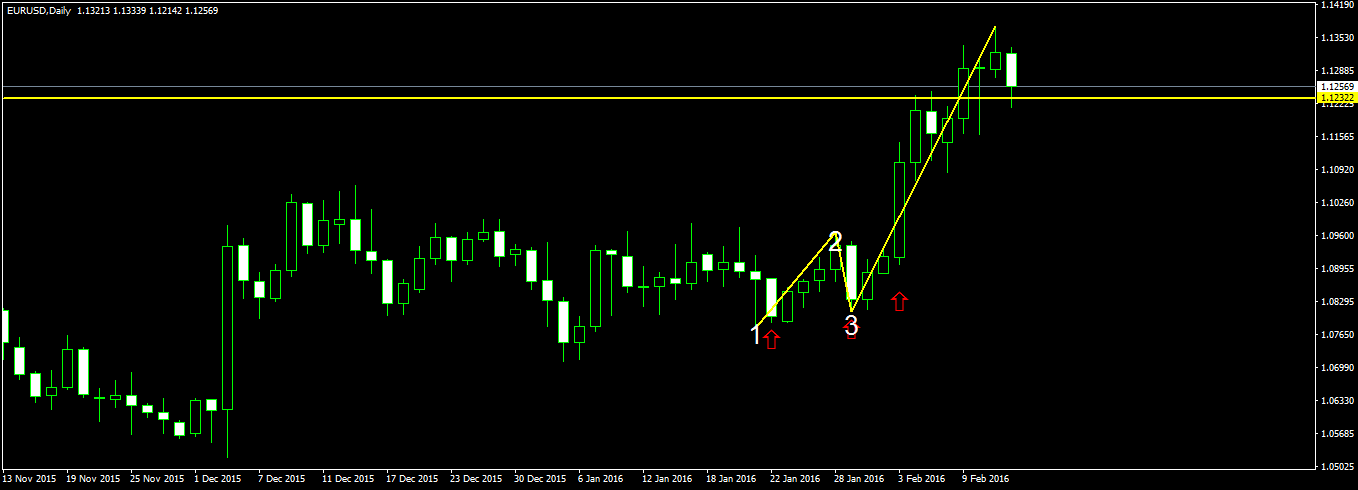
Above is the screenshot for the daily chart that shows the 1-2-3 pattern very clearly. Profit target was hit in 5 days. First position made 400 pips and the second position made 365 pips. So we made a profit of $4K on the first position and a profit of $7.3K. So we made a nice profit of $11.3K in just 5 days.
The key to success in trading is risk management. You should take risk management very seriously. Never ever risk more than 2% on a single trade. In this trade the first position had a risk of 25 pips or $250. For a $10K standard account, it comes to 2.5%. The second position had a risk of 16 pips or $160 which was offset by the profit of the first position which was 65 pips or $650 which means the second position is risk free. So even if the stop loss would have got hit we would have ended up with a profit of $490. After the second position, the trade is risk free. So the most important thing that you should learn is how to manage risk. Since we are trading on the H4 and Daily timeframe we don’t have to look at the charts frequently. A 4 hour candle encompassed 4 hours of price action. When it forms an inside bar in 4 hours it means price could not break the s/r in 4 hours which is a strong signal. If this inside bar forms on the daily timeframe, it is even a more powerful signal.
Now there is a word of caution. Inside bars are also trend continuation signals as well trend reversal signals. There can be many inside bars. You have to look at the overall picture of price action to determine whether this is a trend continuation signal or a trend reversal signal. When the second candle is very small and is formed in the middle of the mother candle, it is a Harami pattern or the trend reversal inside bar that we have been look for. You can also watch this recorded webinar that explains how to correctly identify the start and end of a trend using price action.