In this post we will discuss how to code candlestick patterns in MQL5. MQL5 is very different from MQL4 language. Meta Quotes team has worked hard and designed MQL5 from ground up. MQL5 has been modeled on C++ language. MQL5 is a modern object oriented programming language and is a subset of C++. So if you know C++, you will have no difficulty learning MQL5. MQL4 is a simple procedural language. In this post I am going to discuss how we are going to code bar and price data in MQL5. This is an educational post. In MQL4, it is easy to access Open, High, Low and Close data.There are predefined arrays in MQL4 like Open[ ], High[ ], Low[ ], Close[ ], Time[ ]. But we don’t find these predefined arrays in MQL5. Meta Quotes developer team this time didn’t provide these predefined arrays. Instead we will have to define these arrays according to our needs and use them in our coding. So if you are new to MQL5, you should read this post in which I explain in detail how we are going to code bar and price data in MQL5. In the end I also show you how to code candlestick patterns in MQL5. But before we start coding candlestick patterns, we need to learn how to access bar and price data in MQL5. Watch the video that explains my favorite candlestick patterns.
How To Use Candlestick Patterns in Trading?
Candlestick patterns are great when it comes to predicting the trend. Now keep this in mind. Interpreting these candlestick patterns are most of the time imprecise and vague. You will need a lot of experience when it comes to interpreting them. For example below I show a simple Harami pattern which is also known as the Inside Day pattern. Below is the EURUSD daily chart where I have marked the bearish harami candlestick pattern. The stop loss was only 15 pips. I used a pending buy limit order to fill the order and take profit target was 900 pips which was when the EURUSD long trade got closed. It took more than 50 trading days for the price to reach the intended profit target.
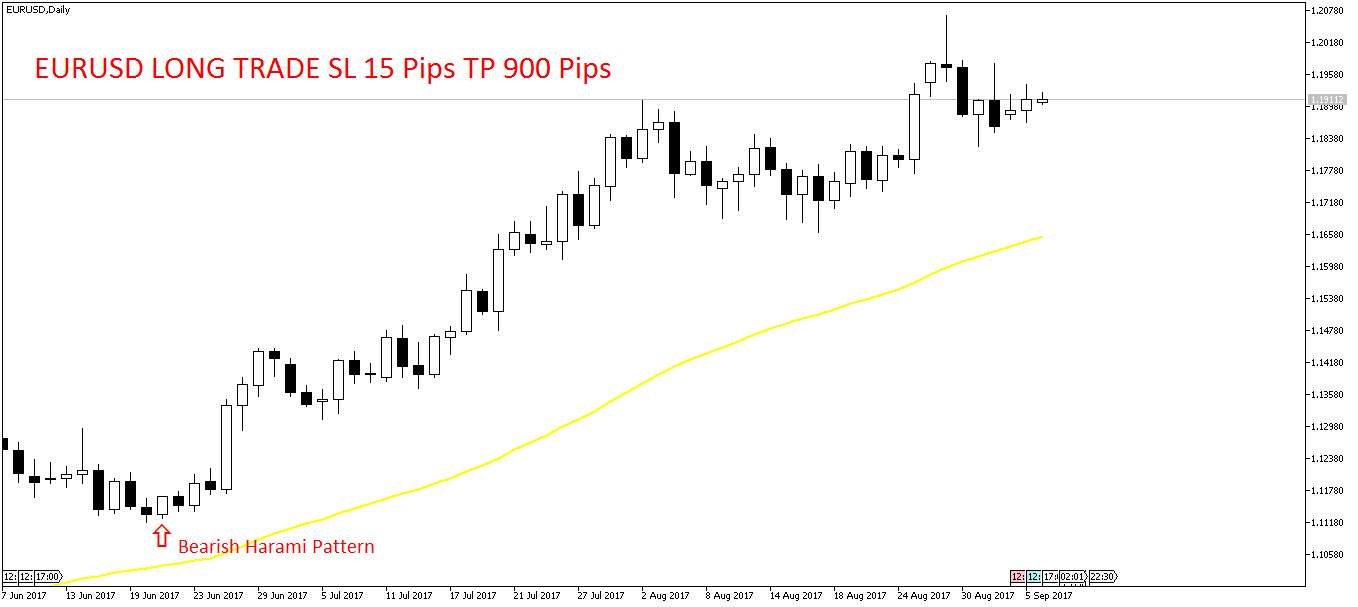
You can see above you need a lot of experience in interpreting candlestick patterns as most of the time you will find them vague and imprecise. Above is a bearish Harami candlestick patterns. Novice traders would have opened a short trade. Just keep this in mind. Harami pattern is neither bearish nor bullish you will have to interpret it Sometimes rather most of the time you will find it to be pure dud which means most of the time you will get false signals with it. But there are traders who love to trade this Inside Day pattern. Inside Day pattern on the daily chart is pretty powerful but you will need experience to interpret the signal.What to do then? If we can develop an expert system that can sift through the price patterns and give an alert when it thinks we have a high probability candlestick pattern. Did you read this post on a NZDUSD long trade that made 200% ROI in 2 days.
If you have taken a rudimentary course in Artificial Intelligence you will know expert systems are being used in many areas like medicine, mining, marketing etc. This is what you do when you develop an expert system. You make the coder sit with the expert in the field who has got a lot of practical experience. Coder tries to translate the expert person knowledge into a program that can analyze different situations and give an alert. This is what we will do here. Try to develop a simple expert system on candlestick patterns in MQL5. We can improve on that simple system. Development is always an iterative process. First we develop a simple system then we make it more accurate. Statistics is the missing link between technical analysis and algorithmic trading. We will have to use some machine learning algorithm that can shift through these candlestick patterns and tell us which one is significant and which one is just dud. Read this post on Statistics the missing link between Technical Analysis and Algorithmic Trading.
Now MQL5 lacks machine learning and artificial intelligence libraries. You will need to learn Python or R if you want to use machine learning and artificial intelligence in your trading system. Learning Python is a good idea. It has now become the defacto language for machine learning and artificial intelligence. Python is a a modern general puirpose object oriented language that you can use for many things. So learning Python is a good idea. You can take a look at my course Python For Traders.
Coding Candlestick Patterns in MQL5
MQL5 is btter than MQL4. We will develop a simple MQL5 program that can identify candlestick patterns. After that we can improve upon it. MQL5 uses a few predefined structures that you need to learn and master if you want to master the art of coding indicators and EAs in MQL5. MqlTick is an important structure. If you don’t know structure, it is just a set of variables that are of different types. Below is the definition of MqlTick:
struct MqlTick
{
datetime time;       // Time of the last prices update
double bid;          // Current Bid price
double ask;          // Current Ask price
double last;          // Price of the last deal (Last)
ulong volume;       // Volume for the current Last price
};
MqlTick stores the time, bid, ask, volume data for each tick. TIck takes places whenever price changes. There can be 10-20 ticks in each minute meaning every few seconds you can get a new tick. Learn 3 simple candlestick patterns tricks that can drastically improve the winrate.This is how we can retrieve data for each tick.
// definition of SymbolInfoTick
bool SymbolInfoTick(string symbol, MqlTick& tick);


MqlTick price;
SymbolInfoTick(_Symbol,price);
double ask = price.ask;
double bid = price.bid;
datetime time = price.time;
First we define an MqlTick object price. Then we use the function SymbolInfoTick to retrieve the price data with the methods price.ask and price.bid. We save these in ask and bid variables. We also retrieve time of the tick with price.time and save that in a datatime variable time. We can also use the following SymbolInfoDouble function to retrieve the current bid and ask prices: SymbolInfoTick tick paramter is passed by reference meaning we can retrieve the MqlTIck data using the price object.
double ask = SymbolInfoDouble(_Symbol,SYMBOL_ASK);
double bid = SymbolInfoDouble(_Symbol,SYMBOL_BID);
So it is upto you which method you use. I would prefer the MqlTick structure. Now as said above unlike MQL4, we will need to create Open, High, Low and Close arrays in MQL5 ourselves. For this purpose we will use MqlRates structures and CopyRates() function. MqlRates is a predefined structure so is CopyRates() is also a predefined function. We will use them.
MqlRates Structure
Structures are list of variables that can be different types. MQL5 has a number of predefined structures. I explained the MqlTick structure above. Now below is the MqlRates structure. Learn how to use fuzzy logic in trading.
struct MqlRates
{
datetime time;
// Period start time
double open;
// Open price
double high;
// The highest price of the period
double low;
// The lowest price of the period
double close;
// Close price
long tick_volume;
// Tick volume
int spread;
// Spread
long real_volume;
// Trade volume
};
Above is the MqlRates structure definition. MqlRates structure holds a lot of information about each bar that includes the time, open, high, low and close as well as the spread and trade volume.
CopyRates() Function
Below is the CopyRates() predefined function.
int CopyRates(
string symbol_name,
// symbol name
ENUM_TIMEFRAMES timeframe,
// period
int start_pos,
// start position
int count,
// data count to copy
MqlRates rates_array[]
// target array to copy
);
You can see CopyRates() returns an integer value. It has a number of input variables. The most important is ENUM_TIMEFRAMES.
ENUM_TIMEFRAMES
This is an enumeration which predefined values. These timeframes are also predefined in MQL5. The predefined timeframes are 1 minute, 2 minute, 3 minute, 4 minute, 5 minute, 6 minute, 10 minutes, 12 minutes, 15 minutes, 20 minutes, 30 minutes, 1 hour, 2 hour, 3 hour, 4 hour, 6 hour, 8 hour, 12 hour, 1 day, 1 week and 1 month. You cannot define your own timeframes in MQL5. For example if you want to go below 1 minute you cannot. There are a lot of people who want to draw candlestick patterns for 30 seconds and 15 seconds that includes me as well. I am highly interested in drawing candlestick patterns for 30 seconds and 15 seconds as I trade 5 minute binary options. 30 second candlestick pattern can predict the next 5 minute candle. But this facility is simply not available. We cannot do anything about it. On Dukascopy JForex we can have candlestick patterns in seconds. You will need Java to code your indicators and EAs on JForex. In the same manner, Oanda platform allows you to make 30 second and 15 second bars. You will need Python to do that coding on Oanda trading platform. Learn how you can use Fuzzy Logic In your trading system.
Below is how we are going to copy the MqlRates data using CopyRates() function:
MqlRates bar[];
ArraySetAsSeries(bar,true);
CopyRates(_Symbol,_Period,0,3,bar);
double open = bar[1].open;
double close = bar[1].close;
Above, this is what we do. First we declare a MqlRates structure as bar[ ]. This is an array as you can see it has got square brackets. Interesting just like CopyRates() that copies MqlRates structure data, we also have a CopyTick() function that copies the MqlTick data into an array. I have already provided you with MqlTick definition. ArraySetAsSeries() function makes sure that the array is indexed as a time series. 0 in the CopyRates() function means that the time series most recent value will be indexed as 0 and the value before that will be indexed as 1 and so on. So we are moving backward when we deal with time series in MQL5. 3 in CopyRates() function means we only save the last three bars. Below is the predefined CopyTick() function:
int  CopyTicks(
   string           symbol_name,
// Symbol name
   MqlTick&         ticks_array[],
// Tick receiving array
   uint             flags=COPY_TICKS_ALL,
// The flag that determines the type of received ticks
   ulong            from=0,
// The date from which you want to request ticks
   uint             count=0
// The number of ticks that you want to receive
   );
Now I had said above that we may not be able to make 15 second and 30 second candlesticks. After finding the CopyTick() function I think it might be possible to make 15 second and 30 second candlesticks. I will try to do it in the end of this post. So keep on reading. The point is if there is no solution posted in any forum, it doesn’t mean there is no solution. So let’s first deal with CopyRates() and make an indicator that gives identifies candlestick patterns for 1 minute and above timeframes. After that we will return to the question of 15 second and 30 second timeframes. You might be wondering why I am interested in 15 second and 30 seconds. I told you I want to trade binary options for 1 minute and 5 minutes. You need to know the following copy functions:
// predefined CopyClose() function in MQL5 Reference Manaul
int  CopyClose(
   string           symbol_name,
// symbol name
   ENUM_TIMEFRAMES  timeframe,
// period
   int              start_pos,
// start position
   int              count,
// data count to copy
   double           close_array[]
// target array to copy
   );

// predefined CopyHigh() function
int  CopyHigh(
   string           symbol_name,
// symbol name
   ENUM_TIMEFRAMES  timeframe,
// period
   int              start_pos,
// start position
   int              count,
// data count to copy
   double           high_array[]
// target array to copy
   );

// predefined CopyLow() function
int  CopyLow(
   string           symbol_name,
// symbol name
   ENUM_TIMEFRAMES  timeframe,
// period
   int              start_pos,
// start position
   int              count,
// data count to copy
   double           low_array[]
// target array to copy
   );

// predefined CopyOpen() function
int  CopyOpen(
   string           symbol_name,
// symbol name
   ENUM_TIMEFRAMES  timeframe,
// period
   int              start_pos,
// start position
   int              count,
// data count to copy
   double           open_array[]
// target array to copy open prices
   );
Above I have given you the definition of the CopyClose(), CopyHigh(), CopyLow() and CopyOpen() function. We are going to use these function for defining candlestick patterns. If you have trader for a while you know this that almost all candlestick patterns are based on either last one bar, last two bars and last three bars.
// declare the close array
double close[];
ArraySetAsSeries(close,true);
CopyClose(_Symbol,_Period,0,3,close);

//declare the high array
double high[];
ArraySetAsSeries(high,true);
CopyHigh
(_Symbol,_Period,0,3,high);

// declare the low array
double low[];
ArraySetAsSeries(low,true);
CopyClose(_Symbol,_Period,0,3,low);

// delcare the open array
double open[];
ArraySetAsSeries(open,true);
CopyClose(_Symbol,_Period,0,3,open);
Now that we have the Open, High, Low and Close timeseries,, we can identifty the candlestick patterns. Below is a diagram that shows a few important candlestick patterns.
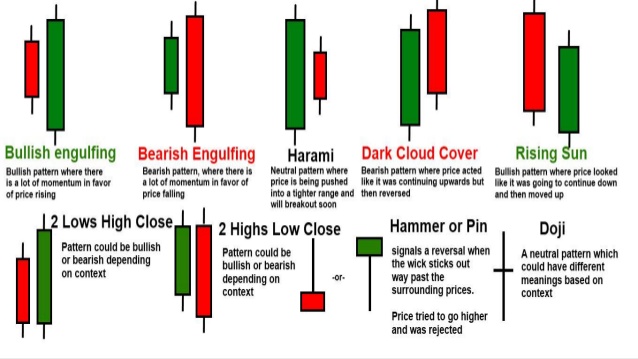
Engulfing Candlestick Pattern
Engulfing candlstick patterns is a trend reversal signal. The body of the last candle is bigger than the previous candle and in the opposite direction. So for a bullish engulfing pattern, previous candle should be bullish with a body bigger than the previous candle that should be bearish. Below ist he code for identifying the engulfing candlestick pattern.
// Bullish engulfing candlestick pattern
if(close[3] < open[3] && close[2] > open[3] && close[1] > open[1])
{
Print("Bullish engulfing reversal pattern detected");
}

// Bearish engulfing candlestick pattern
if(close[3] > open[3] && close[2] < open[3] && close[1] < open[1])
{
Print("Bearish engulfing reversal pattern detected");
}
Harami Candlestick Pattern
Harami candlestick pattern is the opposite of the enguling candestlick pattern. Harami candlestick pattern is formed when the last candle body is smaller than the previous candle. Harami candlestick pattern is not a very reliable pattern. Sometimes it can work and sometimes it does not work. We will need to find some way to improve our predictive power. In the future post I will show you how to do it.
// Bullish Harami candlestick pattern
if(close[3] < open[3] && close[2] < open[3] && close[1] > open[1])
{
Print("Bullish Harami candlstick pattern detected");
}

// Bearish Harami candlestick pattern
if(close[3] > open[3] && close[2] > open[3] && close[1] < open[1])
{
Print("Bearish Harami candlestick pattern detected");
}
Doji Candlstick Pattern
Doji candlstick pattern is an important candlestick pattern. A doji pattern can mean anything. It can mean a breakout. It can mean a trend reversal. A Doji pattern is formed when open and close are almost equal.
// doji candlestick pattern
double body=MathAbs(close[1]-open[1]);
if(body < 0.03*(high[1]-low[1])
{
Print("Doji candlstick pattern detected");
}
Doji code looks simple. There are a number of candlestick patterns that we need to know like the hanging man and the hammer patterns and the shooting star etc. One method is to define a structure that can be used in coding EAs and indicators. We can also define a candlestick patterns class. But I think it would be better to stick with a candlestick structure for now. Structure is just a list of variables that can be of different type.
Hammer And The Hanging Man
Now hammer and the hanging man are two of the most important candlestick patterns. I consider them very important. You can refer to the candlestick patterns diagram above if you don’t know what a hammer or a hanging man is. Hammer and the hanging man are single candlestick patterns. Hammer is seen at the end of the downtrend when price tries to go down but is forced up by huge buying pressure this gives you a long lower shadow. Both patterns are almost the same in appearance. Both have long lower shadows, a small body and a very short upper shadow. Long lower shadow is the result of heavy selling which the buyers were able to recover. Now as said above hammer is seen in a downtrend and is a trend reversal signal while a hanging man is seen in an uptrend and is a also a trend reversal signal. Hanging man is a signal for the start of a downtrend. I have coded the hammer and the hanging man in MQL5 below.
// hammer and the hanging man candlestick pattern
// define the body of the candlestick
double body=MathAbs(close[1]-open[1]);
// define the upper shadow
double UpperShadow;
if (close[1] > open[1])
 { UpperShadow=high[1]-close[1];
 }
 else UpperShadow=high[1]-open{1];
// define lower shadow of the candlestick
double LowerShadow;
if (close[1] > open[1])
{  LowerShadow=Open[1]-Low[1];
}
else LowerShadow=close[1]-low[1];
// define the hammer and the hanging man pattern
if(LowerShadow > 2*body && UpperShadow < 0.1*body
{
Print("Hammer and the Hamging man pattern detected");
}
As said above both hammer and the hanging man patterns look the same but hammer appears in a downtrend and the handing man apears in the uptrend. You will first check whether the trend is down and if the trend is down we have the hammer pattern. In the same manner, we will first have to check whether the trend is up and if the trend is up we will have a hanging man pattern. We can check the trend with MACD. If MACD values are decreasing then we have a downtrend and if MACD values are increasing we have an uptrend. Now one thing i want to point our is that our identification of the hammer and the hanging man as well as the doji pattern was subjective. Did you notice I have said Lower Shadow should be twice the body for the pattern to be hammer or the hanging man. We could have made this condition instead of 2 time we could have said 3 times. Similarly the Upper Shadow should be 0.1 times the body. These are all subjective things. This means we will be getting false signals. But as said in the start of this post we are building a simple candlestick patterns indicators. We will need to add more condtions to make the signals more accurate.
Shooting Star and the Inverted Hammer
Now the shooting star and the inverted hammer are just like the hammer and the hanging man but in the opposite direction. So in case of a shooting star and the inverted hammer we will have the upper shadow big and the lower shadow small.
// Shooting Star and the Inverted Hammer candlestick pattern
// define the body of the candlestick
double body=MathAbs(close[1]-open[1]);
// define the upper shadow
double UpperShadow;
if (close[1] > open[1])
{ UpperShadow=high[1]-close[1];
}
else UpperShadow=high[1]-open{1];
// define lower shadow of the candlestick
double LowerShadow;
if (close[1] > open[1])
{ LowerShadow=Open[1]-Low[1];
}
else LowerShadow=close[1]-low[1];
// define the shooting star and the inverted hammer candlestick pattern
if(LowerShadow < 0.1*body && UpperShadow > 2*body
{ Print("Shooting Star and the Inverted Hammer candlestick pattern detected"); }
Now just like the hammer and the hanging man, shooting star appears at the top of an uptrend. When you spot a shooting star you should prepare for a downtrend. Of course this is the first signal, you should look for confirmation before you enter into a short trade. Inverted hammer appears in a downtrend. Inverted hammer is just the reverse of the hammer. So this has been a long post. if you want to learn MQL5, you should take a look at my MQL5 Programming course in which I show you in detail how you are going to develop EAs and indicators in MQL5.